HI All,
I think this is probably a really easy one but for the life of me i cant find the solution online and the xarray docs don’t seem to have a clear answer to this .
I have taken some of the Global wind atlas data and converted this into a NetCDF file and opened via xarray . The data structure looks like this :
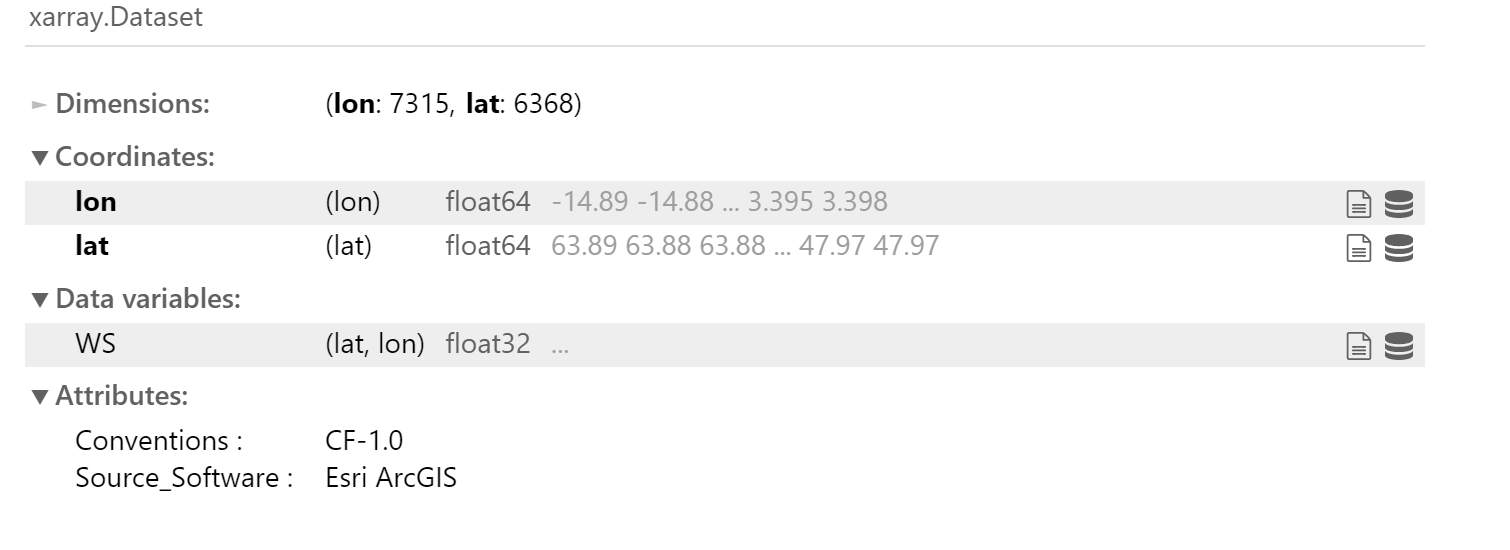
Now I want to add two values, one variable and one coordinate to all latitudes and longitudes. I basically want to add Frequency(variable ) and Sector (Coordinate …I think) so that for every latitude and long i would have wind speed, and freq (allowing me to plot a wind rose)
I should probably note that I am using fake data for freq here , as I am really trying to work out the development of a Plotly-Dash app with a map of wind speed where the user can click on a location and get wind speed and a wind rose . So i am not overly concerned about the accuracy of the data at this stage (this will come later) just want to figure out the bones of the app with fake data.
I have tried the below but this results in a **ValueError** : different number of dimensions on data and dims: 1 vs 3
freq = np.array([7,8,10,5,5,5,15,15,9,7,8,6])
Sector = np.array([0,1,2,3,4,5,6,7,8,9,10,11])
lat = DS['lat'].values
lon = DS['lon'].values


fq = xr.DataArray(freq, coords={ 'lat':lat,'lon':lon,'Sector': Sector},
              dims=['lat','lon','Sector'])
Thanks in advance
David
