This is python-related, honest!
People are always curious about how other people do things. And measuring with wind lidar is something we’d all like to know more about. Are people using 3 lidars for measuring wind resources, or just 1? Are they used with met masts, or not? Why? Are they being used for turbine control or wind farm control?
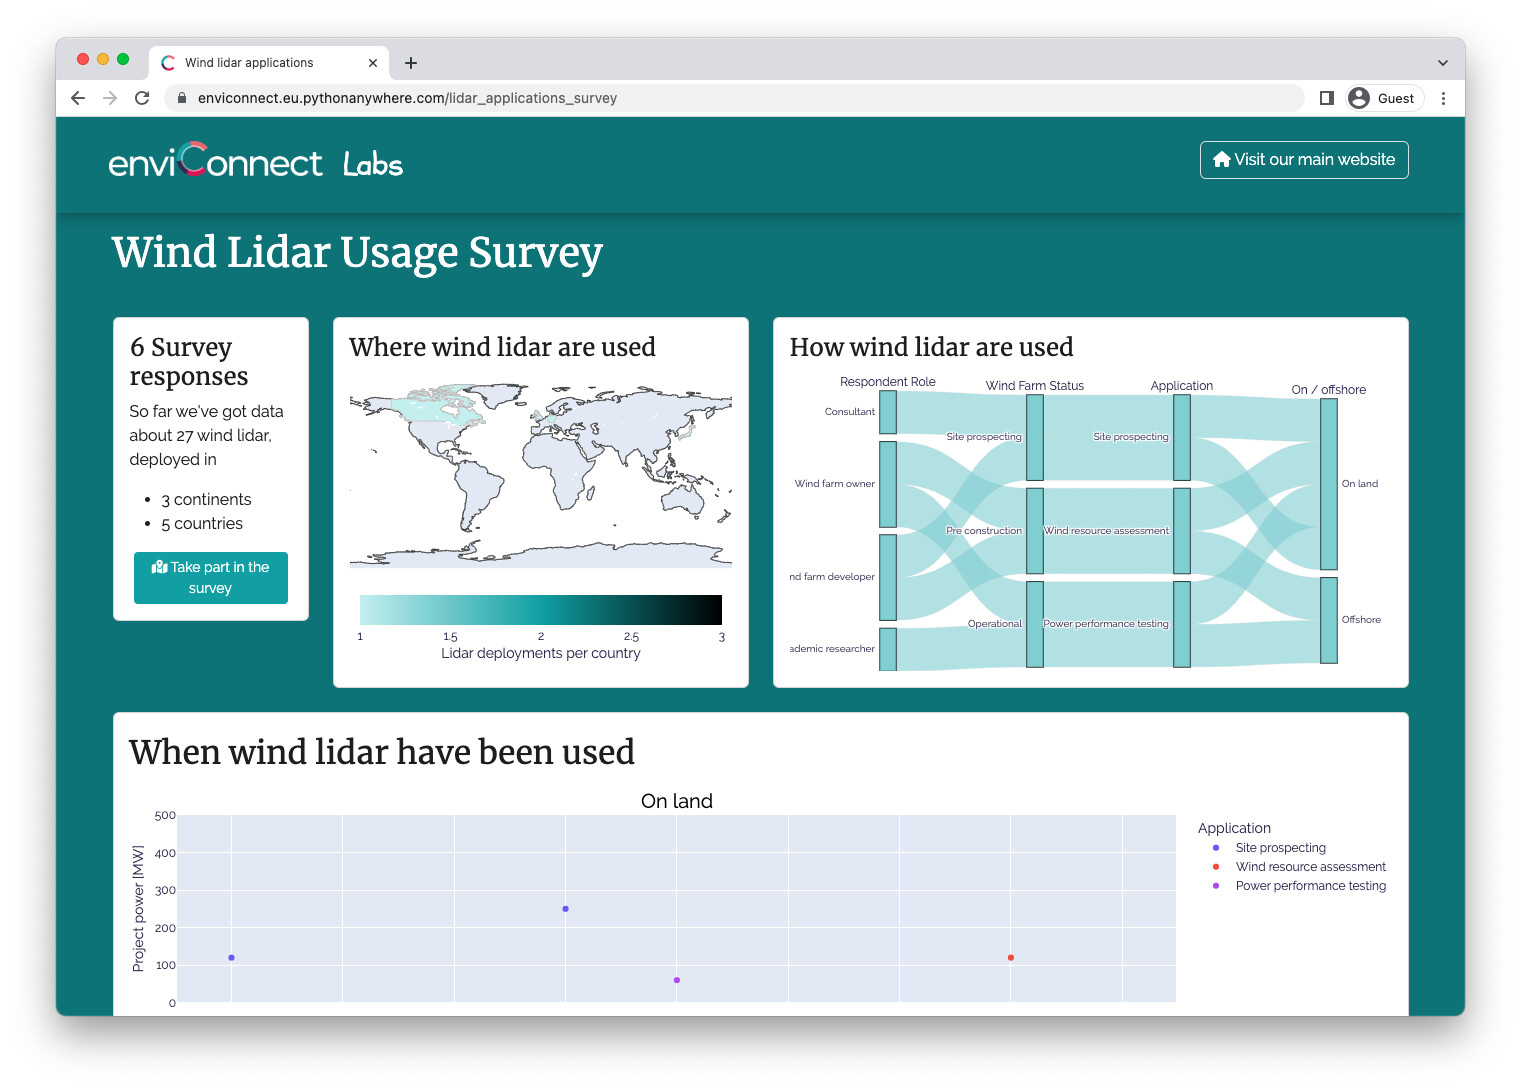
So, we’re launching a survey today about how people use wind lidar for wind energy applications.
It comes in two parts:
- The survey, which is a Google form.
- A visualisation of the results, which is built using Plotly Dash.
It would be great if you could share some information about your most recent wind lidar deployment, whether for wind resource assessment, plant control, lifting safety, or whatever purpose*. Check out the results, then fill in the survey. Thanks!
* if you want to share details about more than one deployment, just fill in the form again
The results
The visualisations update shortly after someone fills in the survey. We’ve got some dummy data in there at the moment to help anonymise early responses.
We’ll be sharing the results later this Summer through various channels including white papers, IEA Wind Tasks, and there might be a conference contribution too.
The Python Stuff
The data processing and display is all built with the open source version of Plotly Dash. I am a fan of Dash because of the speed with which you can from concept to prototype and the ease of deployment.
This was all developed on my local machine. I prototype using Jupyter and then convert to plain python for the Dash App.
It’s deployed to https://eu.pythonanywhere.com/, which is a service to host python-based web services. This has several easy-to-select python versions preinstalled and most packages, but you can easily use pip and install something. Virtual environments can also be used, but they count against your quota. So for some simple applications it might be easier just choose your version of Python in the pythonanywhere control panel, and work with that.
Some notes on using Google Forms
Google forms are great. They are free and quick to set up. The results get dropped into a Google sheet, so it’s very easy to check and moderate the results. I then access the data from the sheet using gspread, which has good documentation and works well.
At one point we thought about doing the whole thing in Google, using a form to collect the data and a sheet to display the results. We decided against it because of the difficulty of doing the analysis we wanted.
Feedback or questions?
I’d love to hear your thoughts on this. Please share any comments here or get in touch with me at andy.clifton@enviconnect.de. Thanks!
We’d also love to hear from you how you are using wind lidar - so please fill in the survey!
Edit 7. June: you lot make awesome beta testers. I didn’t think there would be ways to break this survey, but you’re finding them!