Inspired by @Mdavid800 writing about using Plotly Dash to present data, I decided to see if I could use that service to develop a public-facing app.
Well, turns out you can. I built one that lists wind energy R&D facilities.
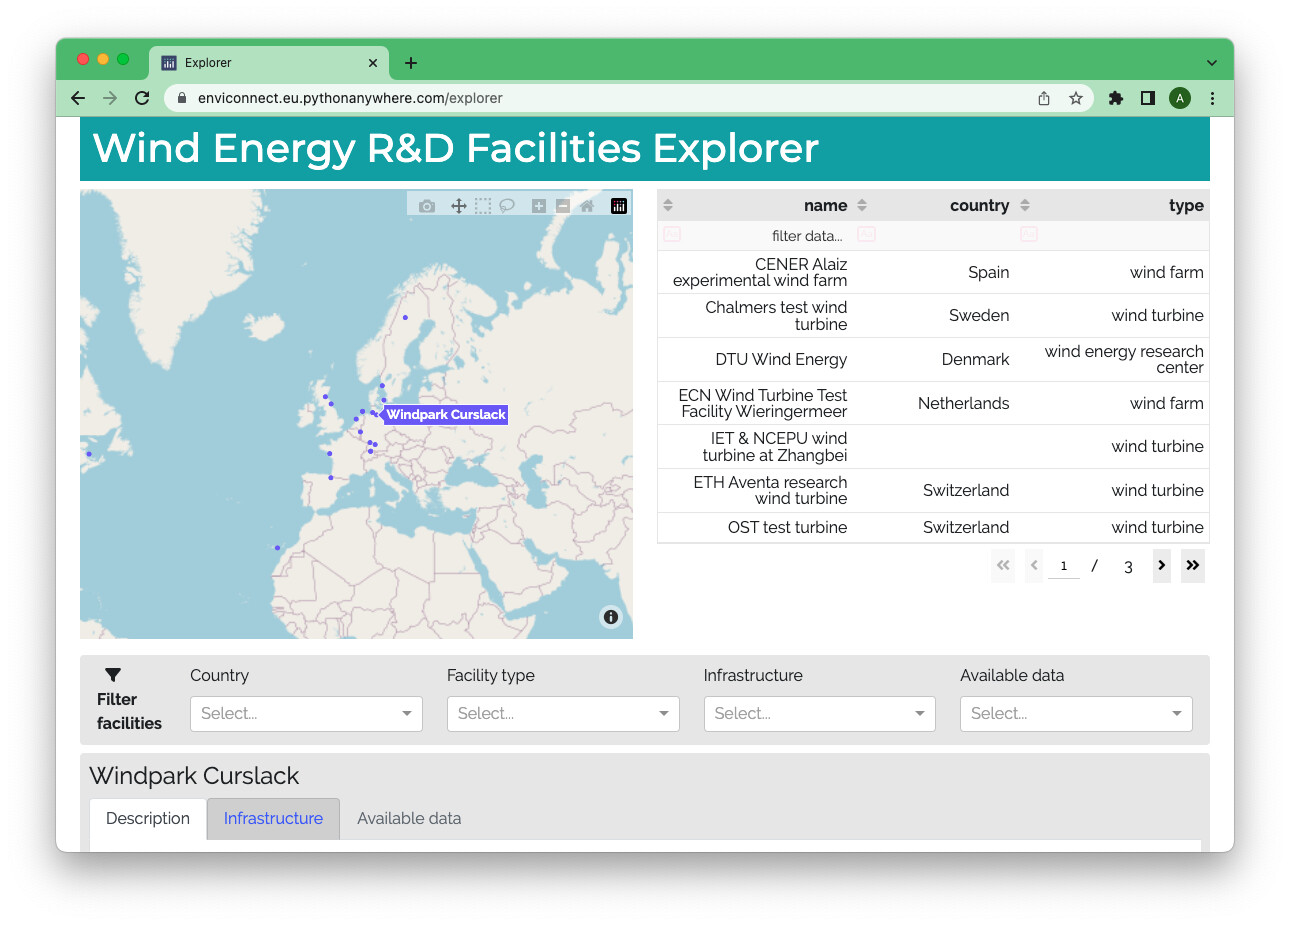
https://enviconnect.eu.pythonanywhere.com/explorer
How it works
- Data about the facilities are pulled in from a yaml file, converted into a data frame and then displayed as a map and tables.
- I mine the data frame to collect information about the countries, facility types, infrastructure, and available data, which then populate the filters.
- Callbacks detect when the user selects a filter, clicks on the map, or in the table.
- Data are filtered and saved in intermediate storage.
- The maps, table, and tabs are updated every time the intermediate storage is updated.
I’m not going to share the code at this time. It’s all fairly simple and based on examples in the Dash documentation, google, medium, and stackoverflow. If you’ve got any questions, just ask!
The development process
The development process is probably familiar.
- Start with a rough sketch of data and functionality
- Set up a Dash layout with the major elements, like the map, table, and information tabs in a notebook
- Figure out the logic and implement callbacks one at a time, e.g. to filter the data set and update the table
- Rework all of the callbacks to use intermediate storage
- Apply bootstrap and set up CSS for theming
- Realise I need an entire website for things like landing pages, privacy policy, publisher information, etc.
- Configure Dash to use multiple pages
The whole of the enviConnect Labs site is the result. It’s built 100% from Dash.
It’s hosted on eu.pythonanywhere.com, so there was also a morning of playing around learning how to set up web servers. This tutorial helped a lot there.
I then use git to pull changes across once I’ve finished local development. The pythonanywhere interface is awesome - just remember to restart the app every so often.
Why not use Django and React or any number of other front-end / back-end solutions?
Yes, I asked myself this. Mostly around midnight when I was struggling with callbacks or CSS.
The reason is that now we have this website framework in place, we can just drop in new single-page apps whenever. And, importantly, Dash is basically a wrapper for React anyway.
You’re missing a facility!
Oops. Please share your feedback here.
Our development roadmap
This is a very early version of the explorer, and we’re planning on doing a bunch of things:
- adding more data, particularly from the Wind Resource Assessment Group’s wiki
- adding publications about facilities
- using different icons for different facility types
… and others. What would you like to see?